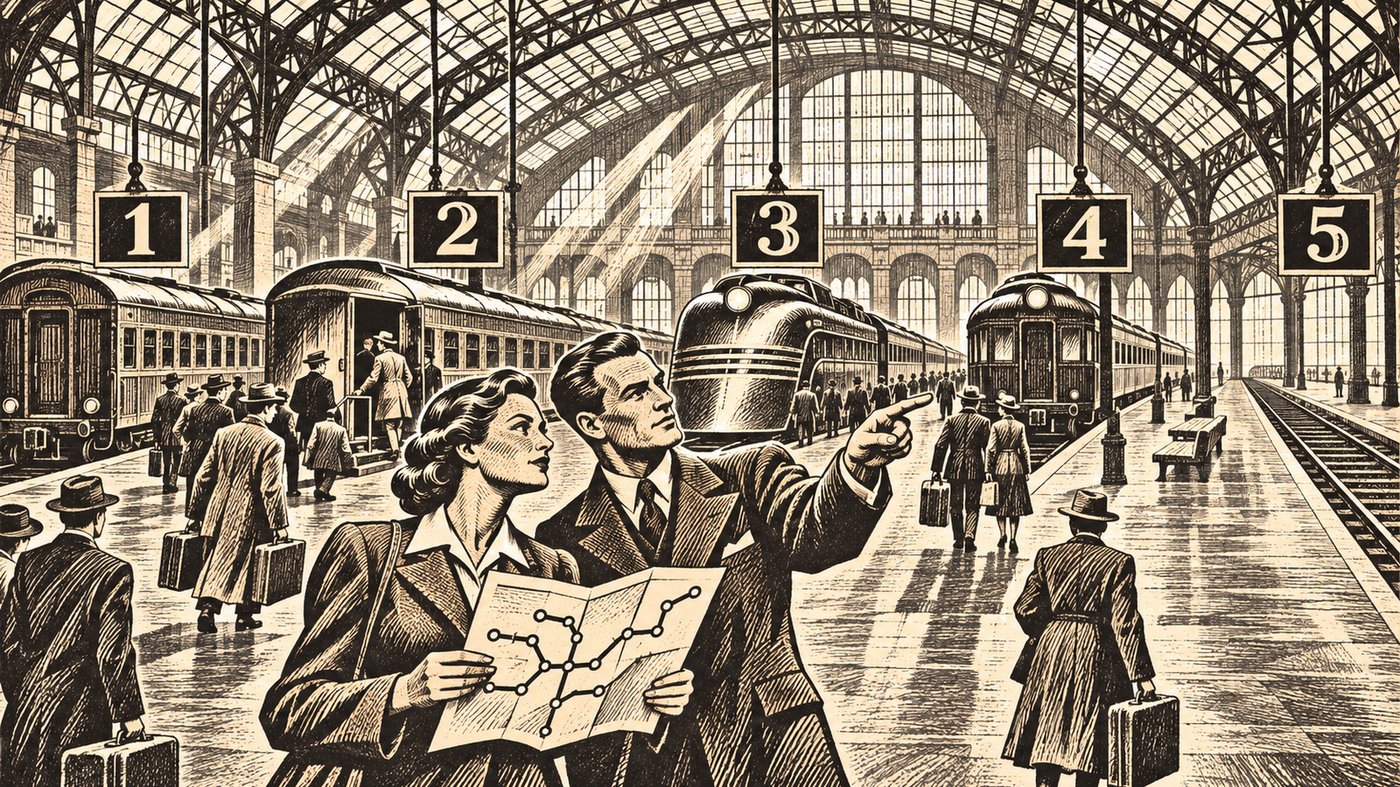
A few years ago, I watched an architect present a beautifully constructed process model to a room full of business leaders.
The diagram was accurate. Every event, activity, decision, message, exception, and handoff had been carefully represented. The architect knew the process. The model proved it.
About ten minutes into the presentation, one of the executives leaned forward and asked the question that ended the discussion:
“What am I supposed to learn from this?”
That was not a failure of intelligence. It was not resistance to architecture. It was not an executive refusing to engage with detail.
It was a failure of communication.
The process model contained nearly everything that could be said about the process. Unfortunately, the audience needed to understand only a few things:
- What are the major parts of the process?
- How do they connect?
- Where does my organization participate?
- Where can the process take different paths?
- Which activities must remain consistent across the enterprise?
- Where are the important handoffs and dependencies?
The model was designed to describe the process accurately. The audience needed a model that helped them navigate it.
Those are not the same thing.
BPMN Solves a Real Problem
Business Process Model and Notation, or BPMN, exists for good reasons.
The Object Management Group describes BPMN as a standard graphical notation that should be understandable to business users while remaining precise enough to represent complex process semantics for technical users. The complete BPMN 2.0.2 specification defines activities, events, gateways, messages, participants, data, choreography, execution behavior, and many other concepts needed to model a process rigorously.
That rigor is valuable.
If you are redesigning a workflow, specifying automation, analyzing exceptions, configuring an orchestration engine, or documenting exactly how work should pass from one role to another, BPMN can be enormously useful. It gives you a shared language and a disciplined way to remove ambiguity.
But detailed accuracy comes at a price.
As you add the information necessary to describe a real process, the notation becomes denser. Gateways multiply. Events acquire different meanings. Boundary conditions appear. Message flows cross pools and lanes. Exceptions that are important to the process designer compete for attention with the main path that matters to everyone else.
The diagram becomes more accurate and less approachable at the same time.
That is not a criticism of BPMN. It is a recognition that one model cannot serve every audience equally well.
Sometimes the business does not need a process specification. It needs a map.
A Metro Map Answers a Different Question
A metro map does not attempt to reproduce the physical world faithfully.
It does not show every curve in the track. It does not accurately represent the distance between stations. It does not describe the signaling system, the track gauge, the operating timetable, or the procedure followed when a train breaks down.
It helps a traveler understand the network.
Harry Beck’s famous London Underground diagram succeeded because it discarded geographical detail that passengers did not need. Transport for London explains that the map was intended to help travelers understand connections rather than emphasize distance and geographical accuracy. Beck used straight lines, limited angles, and clear interchange points to make a complicated network easier to navigate. The result became one of the most influential examples of information design in the world. Transport for London describes that history here.
A former director of the London Transport Museum called the diagram “an essential simplification of the city itself.” That is precisely the point.
A useful simplification is not an inaccurate version of a detailed model. It is a model designed to answer a different question.
Research into metaphorical metro maps has noted the appeal of this visual language outside transportation. People already understand that colored lines represent routes, stations represent recognizable stops, and intersections represent places where routes meet. The visual grammar is familiar before the explanation begins.
That makes the metro map a powerful way to explain a business process.
Think of Stations as Recognizable Subprocesses
On a process metro map, a station should represent a subprocess that people in the organization recognize.
For an employee lifecycle, the stations might include:
- Workforce planning
- Position approval
- Candidate selection
- Offer management
- Onboarding
- Performance management
- Internal movement
- Offboarding
Each station contains work. That work may be complicated. Onboarding alone might include identity verification, equipment provisioning, payroll enrollment, orientation, training, access approval, and dozens of local variations.
The metro map does not need to show all of that.
It needs to show that onboarding is a recognizable part of the employee lifecycle, where it sits in relation to other parts, and which other organizational processes connect to it.
If more detail is necessary, the station can lead to another model. That detailed model might be BPMN. It might be a standard operating procedure, a service blueprint, a responsibility matrix, or an application workflow.
The metro map provides orientation. The detailed model provides instructions.
Do not confuse the two.
Lines Represent Journeys Through the Business
A line on a metro map represents a meaningful path through the process landscape.
One line might follow the employee lifecycle. Another might represent identity and access management. A third might represent equipment provisioning. Those lines intersect at onboarding because all three processes participate there.
This is where the metro metaphor becomes more useful than a conventional flowchart.
Organizations rarely operate through one clean, isolated sequence. They operate through overlapping journeys. A customer complaint may touch customer service, product management, legal review, quality management, and regulatory reporting. A new product may pass through strategy, funding, design, risk, delivery, marketing, and operational support.
Trying to place all of that into one flowchart usually produces either a painfully simplified sequence or an unreadable wall of boxes and arrows.
A metro map allows several routes to coexist.
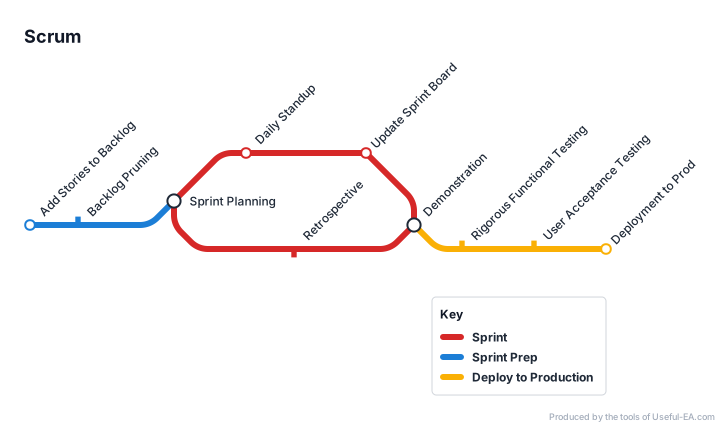
The viewer can follow one line without losing sight of the larger network. Interchange stations reveal the subprocesses where coordination matters most. Parallel routes show that different journeys may use some of the same organizational machinery.
This is not merely attractive visualization. It changes the conversation.
Instead of arguing about the exact order of fifty activities, leaders can ask:
- Which journeys depend on this station?
- Where do different lines compete for the same resources?
- Which interchange creates the greatest delay?
- Where does ownership change?
- What happens to the network if this station fails?
- Which subprocesses must remain consistent across business units?
Those are architectural questions.
Not Every Process Has a Beginning and an End
Many process diagrams are built around a start event and an end event. That is appropriate when the thing being modeled is a transaction with a clear trigger and completion condition.
But many important business processes are ongoing.
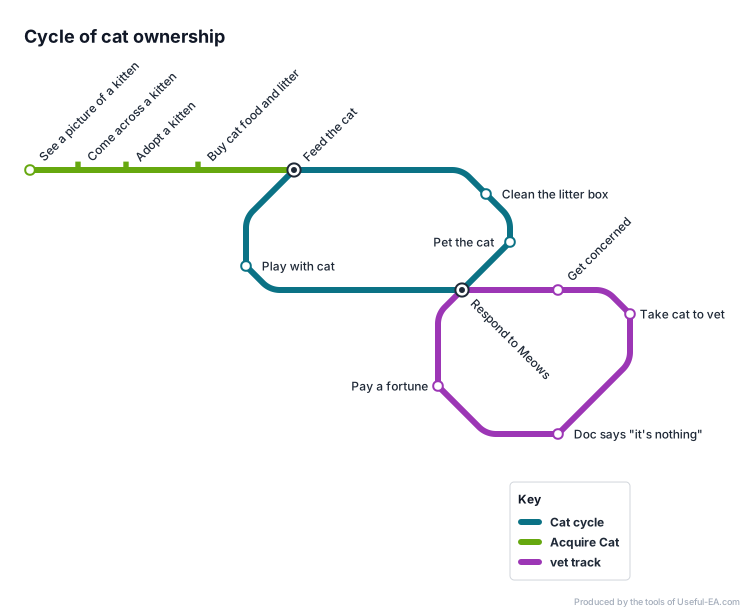
Portfolio management does not really begin or end. Neither do strategy management, risk management, workforce planning, customer relationship management, architecture governance, security management, or continuous improvement.
People enter these processes at different points. Work may cycle. Several activities may occur concurrently. One part of the organization may be reviewing performance while another is setting direction and a third is implementing change.
Forcing an ongoing management process into a left-to-right story can create a false sense of sequence.
A metro map is more tolerant of this reality. Lines can loop. Several stations can act as entry points. Routes can branch and reconnect. A person can begin at the station relevant to the problem in front of them without pretending that the entire enterprise has returned to “Start.”
That flexibility matters when the purpose of the model is shared understanding rather than execution control.
Consistency Does Not Require Identical Execution
A good metro map also provides room for local variation.
Consider a global organization with several business units. Every unit may perform supplier onboarding, but they may not perform it in exactly the same way. Local regulations differ. Risk thresholds differ. Systems differ. The number of approvals differs.
At the enterprise level, Supplier Onboarding can still be a station.
The station establishes that a recognizable subprocess exists and that it connects to procurement, risk management, identity, contracting, payment, and supplier-performance management. The internal implementation of that station can vary where variation is justified.
This creates a useful separation:
- The enterprise model defines the station, its purpose, its connections, and its expected outcome.
- The local model defines how a particular part of the business performs the work.
Too many process-standardization efforts confuse consistency with uniformity. They attempt to force every local activity into the enterprise diagram. The result is often a model so detailed that nobody can see what is actually supposed to remain consistent.
Keep the network stable. Allow the stations to adapt.
How to Build a Useful Process Metro Map
Start with the audience, not the notation.
1. Write down the questions the map must answer
Do not begin by collecting every process activity. Begin with the decisions and conversations the map should support.
If the audience needs to discuss ownership, show ownership. If it needs to identify handoffs, emphasize interchange stations. If it needs to understand customer journeys, organize the lines around those journeys.
2. Identify the major journeys
A journey should be meaningful to the audience. It might represent a customer lifecycle, a value stream, a management process, a regulatory obligation, or the movement of information through the organization.
Keep the number of lines manageable. If the viewer cannot visually follow a route, the map has stopped doing its job.
3. Name recognizable stations
Use the language of the business.
A station should be large enough to represent meaningful work but specific enough that people recognize what happens there. “Manage Business” is too broad. “Validate Customer Identity” is probably recognizable. “Check field 17 against table C” belongs inside the station, not on the network map.
4. Find the interchanges
Interchanges are where lines meet.
They often reveal shared capabilities, important handoffs, common information, scarce expertise, or organizational friction. These are frequently the most architecturally significant points on the map.
5. Show meaningful branches and loops
Do not add every exception. Add the alternatives that change how the business understands the process.
A branch may represent a genuinely different route for a product, customer, jurisdiction, risk level, or operating model. A loop may represent review, learning, remediation, or continuous improvement.
6. Validate the map in conversation
Put the map in front of people who do the work.
Ask them to trace a real scenario. Where did they enter? Which stations did they use? Where did they change lines? What important connection is missing? Which station name makes no sense outside the architecture team?
If people cannot tell their story with the map, revise it.
7. Link important stations to detailed models
The metro map should not become a dumping ground for procedural detail.
Where precision is needed, connect a station to its BPMN model, procedure, policy, application workflow, controls, measures, or supporting architecture. Maintain different levels of description for different purposes.
Where the Metro Tool Fits
I created the Useful EA Metro Map Modeler to support this kind of high-level process communication.
The tool uses the visual language of metro systems—lines, stations, routes, branches, and interchanges—to describe how recognizable subprocesses connect. Its purpose is not to make BPMN obsolete. BPMN remains the stronger choice when you need detailed process semantics, exact workflow behavior, or automation specifications.
The metro tool serves the conversation that often needs to happen first.
It helps an architect and a group of stakeholders establish the shape of the process landscape before descending into detailed procedure. It creates a model that can be used in a workshop, placed in front of an executive, or reviewed with business teams without requiring everyone in the room to learn a formal process-modeling language.
That is the real test of a high-level process model.
Can people use it to have a better conversation?
Accuracy Is Not the Only Measure of a Model
Architects are trained to value completeness and precision. We should.
But a model that contains the truth and conceals the meaning has failed.
BPMN can describe exactly how work happens. A metro map can help people understand where they are, how the major parts connect, which paths they can follow, and where coordination matters.
Use BPMN when the details are the point.
Use a metro map when the network is the point.
The best process architecture may need both. But if your audience is staring at a technically correct diagram and asking what they are supposed to learn from it, do not blame the audience.
Give them a map they can use.