Metro Map Modeler · A process description tool
Your Process Model May Be Correct. Give People a Map They Can Use.
A detailed process model tells you exactly how the work is done. Most audiences need something else: the major parts, how they connect, where they take part and where the handoffs are. The Metro Map Modeler describes your high-level processes as a metro map anyone can read. Each journey is a line, each recognizable sub-process is a station, and where journeys share a station, they meet at an interchange.
Runs in your browser and is included in every Useful EA plan; accounts are free during the beta. See pricing →
Accurate is not the same as usable
A process model can capture every event, decision, exception and handoff, and still leave a room of business leaders asking, “What am I supposed to learn from this?” That isn’t a failure of the audience. It’s a model built to answer a different question. Most of the people who run, fund and change a process need to know only a few things:
- What are the major parts of the process?
- How do they connect?
- Where does my organization take part?
- Where can the process take different paths?
- What must stay consistent across the enterprise?
- Where are the important handoffs and dependencies?
A model that describes a process accurately is not the same as a model that helps people navigate it. Sometimes the business doesn’t need a process specification. It needs a map.
A metro map answers a different question
A metro map doesn’t show every curve in the track or the true distance between stations. It leaves out what travellers don’t need, so they can see the network: the routes, the stops, and where to change. And everyone already knows how to read one. Coloured lines are routes, stations are stops you recognize, and interchanges are where routes meet.
The Metro Map Modeler is a process description tool built around that idea. It isn’t a less accurate version of your detailed process model. It’s a different model, made to show the shape of your process landscape to the people who have to work in it.
Each station is a sub-process people recognize
The Metro Map Modeler is usually used for high-level processes. Each line is a journey through the business, and each station on it is usually a more detailed sub-process in its own right. On an employee lifecycle that might be Workforce planning, Position approval, Candidate selection, Offer management, Onboarding, Performance management, Internal movement and Offboarding.
Onboarding alone may hold identity checks, equipment, payroll, orientation, training and access approvals. The map doesn’t need to show all of that. It shows that Onboarding is a recognizable part of the lifecycle, where it sits, and what connects to it. The map gives orientation; the detailed model gives instructions.
When the conversation goes one level down, each station carries what you know about that sub-process: a description, an owner role, its duration, volume and cost, the applications and capabilities it relies on, and notes, including where its detailed procedure or process model lives.
Lines are journeys through the business
Organizations rarely run on one clean, isolated sequence. They run on overlapping journeys. A customer complaint can touch customer service, product management, legal, quality and regulatory reporting. Put each journey on the map as its own line, and they can coexist: you can follow one line without losing sight of the network.
Where lines share a station, they meet at an interchange. Employee lifecycle, Identity and access, and Equipment provisioning all pass through Onboarding. Interchanges are where coordination matters most, and they are often the most architecturally significant points on the map. Instead of arguing about the order of fifty activities, leaders can ask better questions:
- Which journeys depend on this station?
- Where do different lines compete for the same resources?
- Which interchange creates the greatest delay?
- Where does ownership change?
- What happens to the network if this station fails?
- Which sub-processes must stay consistent across business units?
Not every process has a beginning and an end
Traditional process-mapping tools assume a process has a start and a finish. That fits a transaction with a clear trigger and a clear completion. But portfolio management, strategy, risk, workforce planning, architecture governance and continuous improvement don’t really begin or end. People join them at different points, work cycles round, and several parts run at once.
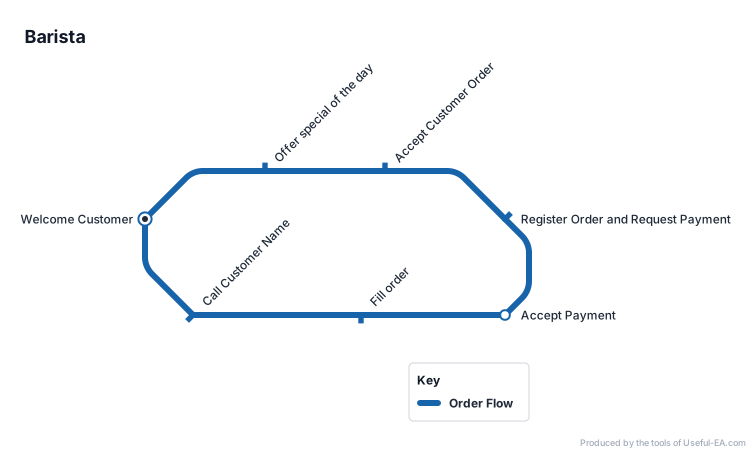
Force one of those into a left-to-right story and you describe a sequence that doesn’t happen. A metro line can loop: make a process’s first and last step the same and the line closes into a racetrack. Lines can branch where the process can go different ways and merge where the paths rejoin, and people can start at whichever station fits the problem in front of them. That makes the Metro Map Modeler highly valuable for continuous processes, the ones a start-to-finish description gets wrong.
Consistency doesn’t require identical execution
Every business unit may onboard suppliers, but not in exactly the same way. Regulations, risk thresholds, systems and approvals differ. At the enterprise level, Supplier onboarding is still one station, connected to procurement, risk, contracting and payment.
The enterprise map defines the station: its purpose, its connections and its expected outcome. Each part of the business defines how it does the work. Too many standardization efforts confuse consistency with uniformity and push every local activity into the enterprise model, until nobody can see what is supposed to stay the same. Keep the network stable. Let the stations adapt.
Start with the audience, not the notation
-
Decide what the map must answer
Begin with the decisions and conversations the map should support, not with every activity. They tell you which journeys to draw.
-
Type each journey as a line
Type or paste a journey’s stations, one per line, then name the line and choose its colour. Or import a spreadsheet of steps as CSV.
-
Name stations in the business’s language
“Manage business” is too broad; “Validate customer identity” is recognizable. A station name already on the map becomes an interchange.
-
Show the branches and loops that matter
Not every exception: just the alternatives that change how people understand the process. Tracks re-route themselves as you move stations.
-
Test it with the people who do the work
Share the map and ask them to trace a real case. Show one line at a time from the key. If they can’t tell their story with it, revise it.
-
Take it to the meeting
Export to PowerPoint as editable shapes, to PNG, JPG or SVG, or print it. Export the stations to CSV for analysis or for another tool.
Every station is a sub-process, not a picture
Shared stations are one station
A sub-process several journeys share is one station, with one description and one set of measures. The lines meet there, at an interchange.
Loops, branches and merges
A continuous process loops. A process that can go different ways branches, and the paths can merge again later.
Readable by construction
Tracks run horizontally, vertically or at 45°, turn gently, and run side by side where journeys follow the same route, so the map stays clear as it grows.
Station details
Description, owner role, duration, volume, cost and notes on every station.
Applications and capabilities
Link a map to an Application Portfolio and a Capability Modeler model, then list the applications and capabilities each station uses.
An active key and zones
Show or hide each line from the key to follow one journey. Shade zones behind the map for phases, departments or systems.
Interchange links
Show that people change between two separate stations, drawn as two stations joined by a short bar.
Editable PowerPoint
The slide is made of real PowerPoint shapes, grouped by line, with each line’s stations in the speaker notes.
CSV in and out
Every field you can enter goes out to CSV and comes back in. Imports are checked row by row before anything is saved.
Explicit sharing
Share a map with Viewer, Editor or Full access. Being in the same company gives nobody access by itself.
AI assistants
Connect an AI assistant to read your maps and answer questions about your processes. It changes a map only if you tick a separate box to allow it.
Use both, for different questions
The Metro Map Modeler isn’t a BPMN tool, and it doesn’t make BPMN obsolete. There are no gateways, events, pools or messages, and nothing runs. It serves the conversation that usually needs to happen first: agreeing the shape of the process landscape before anyone descends into detailed procedure.
Use BPMN when the details are the point
Redesigning a workflow, specifying automation, analyzing exceptions, or configuring an orchestration engine.
Use a metro map when the network is the point
Showing executives and business teams how the major parts connect, where journeys meet, and where coordination matters.
Useful today, and still growing
The Metro Map Modeler is in beta. Maps, the process wizard, station details, the key, zones, sharing, and the PowerPoint, picture and CSV exports work today. It will keep improving as architects use it on real processes.
Because every map exports to CSV, you can always keep your own copy of your process data.
Frequently asked questions
What does a station stand for?
A sub-process people in your organization recognize. On a map of high-level processes, each station is usually a more detailed sub-process in its own right, with its own description, owner role and measures.
Can a process loop?
Yes. Make the first and last stations the same and the line closes into a loop, drawn as a racetrack. That is how continuous processes, such as portfolio management or service operations, are described.
What happens when two journeys share a station?
They share one station, which becomes an interchange. The station has one description and one set of measures, whichever line you reach it from.
Can I start from a list or a spreadsheet?
Yes. Paste a list of steps into the process wizard to make a line, or import a CSV of steps. Steps without a position are placed for you, and stations already on the map never move.
Can I use the map in PowerPoint?
Yes. The PowerPoint export is made of editable shapes. Each line is a group named after the line, so you can select it, move it or recolour it in one go.
Does it connect to the other Useful EA tools?
A map can be linked to an Application Portfolio and a Capability Modeler model, so each station can list the applications and capabilities it uses. The other tools aren't changed by it.
Can an AI assistant read or change my maps?
An AI assistant you connect to Useful EA can read the maps you can open. It can change maps you can edit only if you tick “Also let it change Metro maps you can edit” when you connect (in a company account, the company’s AI setting must also allow changes), and then its changes go straight into the map.
Does it replace BPMN?
No. It describes processes so people can understand and navigate them. When you need detailed process semantics or something a workflow engine can run, use BPMN, and note in the station where that model lives.
The idea, and how to use it
Nick Malik’s article Your Process Model May Be Correct. That Does Not Mean Anyone Can Use It. explains why a metro map is a good way to describe a process, and how to build one people can use.
The Metro Map Modeler User Guide covers every part of the tool: lines and stations, the process wizard, interchanges, the key and zones, exports, CSV, sharing and AI assistants.
Give them a map they can use
Start with the sample map, or type the stations of a process you know well and see where it meets the others.
Open Metro Map Modeler →